Our first task in the seminar was to recreate a 3D-annotated map using Google Earth Pro and add descriptors to the map using Adobe Illustrator. We replicated the map that displayed aerial imagery from Google Earth Pro from the New York Times' article about the Chelsea bombing. The intent of the map in their story is to offer their readers a clearer visual of where the bombing took place by juxtaposing other buildings and street names around the scene of the crime. I believe that this is an excellent use of data visualization in a story - despite the fact that a plain image of a map with labels may not be traditionally considered a formal data visualization.
I wanted to try my hand at creating a 3D-annotated map of my own. I had initially wanted to zoom in on my home in Thailand, but Google Earth Pro's 3D building scenes are not as robust in places outside the United States (I hope that data can be as readily available beyond the United States someday). So, I chose to go with Boston University, which is where I completed my undergrad degree.
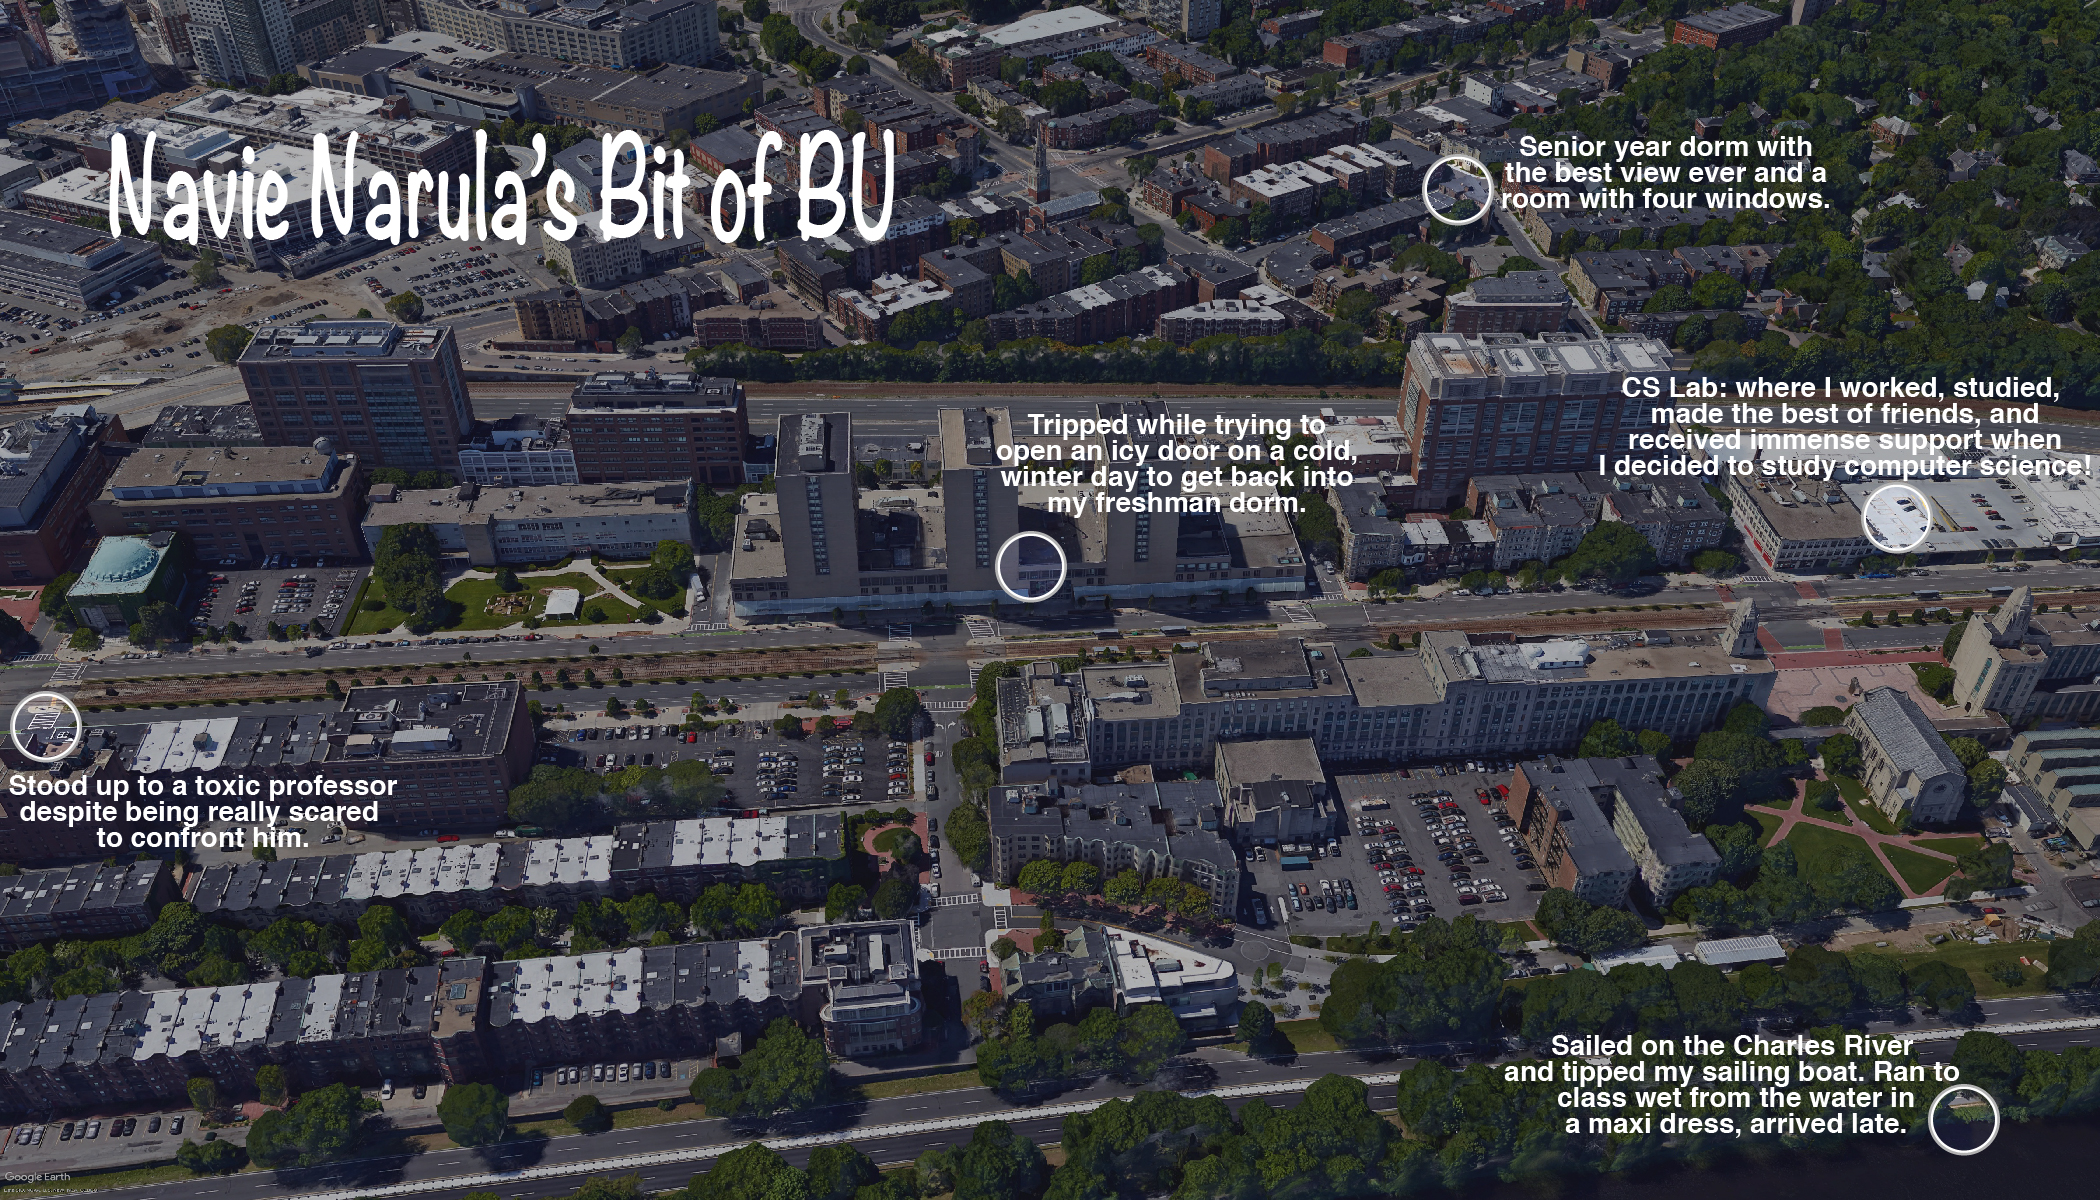
Here is my final product:
It's best to use this kind of map to narrate a story in a small area so that readers can also feel as if they are in the location with you, bringing the story a little closer to "home" - wherever that may be. Of course, my example here is only meant for fun and I don't intend to publish my five moments at Boston University in a paper. I just wanted to recreate a small scence to share my story in a way that I thought was not possible via a map.
If I would actually like to publish this map in an actual story and make the text searchable, I might want to use the ai2html script while exporting my files in Adobe Illustrator. This was all in good fun, though, so I saved the image as a JPEG.
Overall, I'm really enjoying this seminar and learning more about how to visualize geographic data. We learned about Google Earth Pro and Adobe Illustrator this week. Next week, we will be exploring QGIS.